Search
Menu
Visitor Info

Stay updated on the latest neighbourhood news
This site uses cookies. To find out more, see the Cookie Policy.
Consent management
We use cookies to enhance and customize your browsing experience on this website.


Traffic Trends
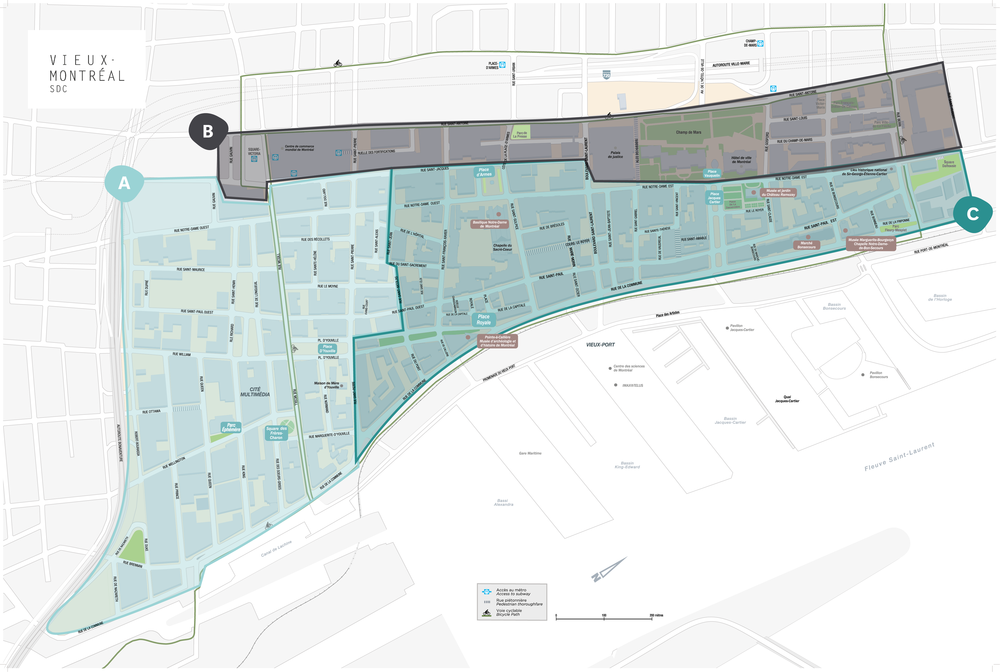
The SDC Vieux-Montréal owns a network of 19 pedestrian counters distributed throughout its territory. These counters allow for in-depth collection and processing of field data, in addition to daily foot traffic readings.

Monthly Reports: 2026 Traffic Trends
*Reports are available in French only
Monthly Variations
This table highlights increases or decreases in foot traffic over a one-month period as contrasted between two reference years. For example, we observed an increase in foot traffic of 24.7% between the January 2023 and January 2024 data readings.
Traffic Trends - Monthly Variations
To find out the exact value of the variation, please hover over the coloured bars in the table.
Key Day Variations
This table highlights increases or decreases in foot traffic during a targeted period as contrasted between the current and last year. These key times typically represent periods of higher-than-average traffic in the historic district.
Traffic Trends - Key Day Variations
To find out the exact value of the variation, please hover over the coloured bars.
Peak Day of Current Year
Busiest day of the current year, as of last update:
Thursday, January 1
Last year’s peak day: Saturday, August 2

The information presented here is continuously updated.
Last updated on February 18, 2026.
For more information regarding this data, please contact us.

